Top-down Microarchitecture Analysis
Just as doing anything else complex in the world, performance engineering needs a good methodology to start with. A lot of time people have a spark in their mind “Oh it must be that {cache/IO/network/threading/anything} that my code is running slow” and head down immediately into optimization, only to find out that it is not the bottleneck of the program in the end.
The TMA (Top-down Microarchitecture Analysis) is a good methodology proposed by Intel in 2014. It helps to identify ineffective usage of CPU microarchitecture of a program on a high level and could be used to establish a target direction for performance optimization.
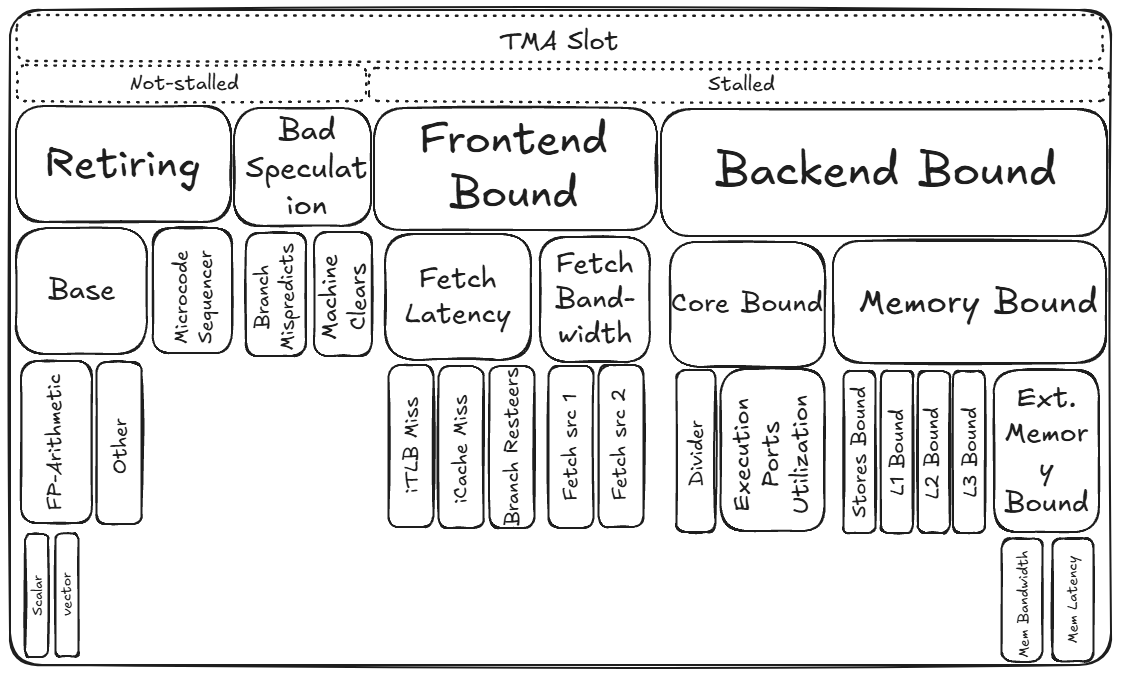
The above is a breakdown diagram of how TMA methodology analyzes the execution of a program. Let’s walk through it step by step:
- Retiring: “Useful work”. Micro-ops execute and retire successfully.
- Base: Normal retired work from the regular decode/uop cache path
- FP-Arithmetic: retired instructions doing floating-point arthimetic
- Scalar: FP math using scalar instructions
- Vector: FP math using vectorized instructions (SSE/AVE)
- Other: non FP-Arithmetic instruction like integer ALU, load/store, control-flow, etc.
- FP-Arithmetic: retired instructions doing floating-point arthimetic
- Microcode Sequencer: Complex instructions (e.g. string ops) expanded by microcode into many internal uops; they retire but often with lower throughput.
- Base: Normal retired work from the regular decode/uop cache path
- Bad Speculation: Wasted work because speculation was wrong; uops execute but do no retire.
- Branch Mispredicts: Incorrect branch predications; work on the wrong is flushed.
- Machine Clears: Pipeline clears for non-branch reasons (memory-ordering violations, faults/traps, self-modifying code, etc.)
- Frontend Bound: The frontend (fetch/decode/uop cache) cannot supply uops fast enough.
- Fetch Latency: The frontend is waiting for instructions to arrive.
- iTLB Miss: Instruction-side TLB miss; page walk needed before fetch continues.
- iCache Miss: instruction cache miss (L1i). the frontend must fetch instructions from L2/L3/DRAM
- Branch Resteers: Frequent redirections of the fetch target (taken branches, returns, indirect jumps) create bubbles.
- Fetch Bandwidth: the frontend cannot deliver enough micro-ops per cycle to keep backend busy
- Fetch Latency: The frontend is waiting for instructions to arrive.
- Backend Bound: The backend cannot complete the instructions provided by the frontend fast enough.
- Core Bound: the backend is limited by execution resources and data-dependence scheduling
- Divider: Stalls from long-latency integer/FP divide units.
- Execution Port Utilization: Too many micro-ops competing for the same execution ports/units
- Memory Bound: the backend is waiting for data to perform operations upon
- Store Bound: Store-side bottlenecks (store buffer pressure, write combining, store-forwarding issues, commit bandwidth limits).
- L1 Bound: Delays at L1D (misses or structural conflicts)
- L2 Bound: Waiting for data from L2 (missed in L1)
- L3 Bound: Waiting for data from LLC (missed in L2)
- External Memory Bound: Data served from beyond the LLC-local DRAM, remote NUMA DRAM, or persistent storage
- Core Bound: the backend is limited by execution resources and data-dependence scheduling
By performing such a TMA on the program at hand, we would have a better direction on which part needs optimization and dig further.
A final word of caution before we dive in detailed optimizations, there is no substitute for reading the code and knowing what it is doing. Ultimately we need to pinpoint the exact lines that are not performant and work on it.
Optimize Memory Access
Modern computers’ memory operations account for the largest portion of performance bottlenecks and power consumptions. In this section we look at a few advices on how to optimize the program when TMA shows Memory Bound. Meanwhile, remember that there is always a viable option to buy better hardware: invest in a server with more memory channels or DRAM modules with faster transfer speed.
Cache-Friendly Data Structures
Access Data Sequentially
To exploit spatial locality of the caches, making sequential memory access is very beneficial. It helps to bring in the next chunk of data needed ahead of time and facilitate hardware prefetching mechanism.
// bad
for (col = 0; col < NCOLS; col++) {
    for (row = 0; row < NROWS; row++) {
        matrix[row][col] = row + col;
    }
}
// good
for (row = 0; row < NROWS; row++) {
    for (col = 0; col < NCOLS; col++) {
        matrix[row][col] = row + col;
    }
}
Know and Choose the Right Container
Understand how the built-in containers are built in the programming language you are using. For example, in C++ std:list requires additional pointer chasing in traversal. When appropriate, std::vector or std::array might yield better cache locality.
Packing the Data
By making the data more compact, the cache utilization could be improved. For example, here if we know the member a, b and c of struct C is a small enum value, we could use bit fields to pack them from 3 bytes each to just 1 byte each. This reduces the memory transferred and taken in cache.
// S is 3 bytes
struct S {
    unsigned char a;
    unsigned char b;
    unsigned char c;
}

// S is 1 byte
struct S {
    unsigned char a:4;
    unsigned char b:2;
    unsigned char c:2;
}
And also by rearranging the order of the fields in the struct, we could avoid additional padding inserted by compiler. Or we could explicitly ask compiler to remove any padding by __attribute__((packed)).
// S is 12 bytes
// b pad pad pad i i i i s s pad pad
struct S {
    bool b;
    int i;
    short s;
}

// S is 8 bytes
// i i i i s s b pad
struct S {
    int i;
    short s;
    bool b;
}
Gathering Relevant Fields
Imagine in the game programming, the Soldier struct would need access attack, defense and health in the battle stage, coords and speed in the marching stage. We should group close together those fields that are likely to be accessed together.
struct S {
    unsigned attack;  // battle
    unsigned defense; // battle
    unsigned health;  // battle
    2DCoords coords;  // marching
    unsigned speed;   // marching
}
Dynamic Memory Allocation
Dynamic memory allocation has quite a few associated costs:
- it might need OS to perform a system call
- in multi-threaded applications, dynamic memory allocation might need synchronization
- demand-paging might incur the cost of page fault for every newly allocated memory page when accessed.
People have come up with different solutions to these issues. One way is to design a user-space memory allocation library that requests a big chunk of heap space from the OS and conducts allocation and deallocation in user-space by the library itself. Examples include jemalloc, tcmalloc, etc.
In real-time-senstitive applications like embedded system or high-frequency-trading, people usually statically allocate all the needed space at the very beginning of the program and only deallocate them at the end of the program’s execution. It requires to know how much space the application would need and reuse space in an efficient manner.
Reduce DTLB Pressure
TLB is a fast but small hardware device per-core that performs the virtual-to-physical address translations. Huge page is a mechanism to increase the TLB hit rate by increasing per memory page size. On Linux default page size is 4KB, and 2MB/1GB huge pages are available as well. There are Explicit Huge Pages (EHP) and Transparent Huge Pages (THP).
Explicit Huge Page: the huge pages are reserved during boot time via hugetlbfs and could be allocated with mmap(..., MAP_HUGETLB).
Transparent Huge Page: it could either be enabled system-wide by setting “always” in /sys/kernel/mm/transparent_hugepage/enabled or process-wide by setting “madvise” and madvise(ptr, size, MADV_HUGEPAGE) on an allocated heap memory area.
The overall tradeoff is that EHP requires additional system configuration for reserving the huge page upfront while THP incurs non-deterministic overhead from the kernel to manage the fragmentation and swapping. So for realtime-critical applications EHP is preferred while for client-facing applications like database THP is more flexibly adopted.
For a more in-depth discussion on TLB, refer to my blog TLB & Huge Page
Explicit Memory Prefetching
By now we know it’s expensive and likely lead to stall if the program has to fetch the memory location from DRAM instead of any level of D-cache. Modern CPUs have hardware prefetching mechanism but it suffers to predict correctly if the access pattern is not easily predictable. Alternatively programmer could explicitly hint the CPU to prefetch a memory address ahead of time in the hope that by the time the program needs to access it, it will already be in the D-Cache.
Consider the following example with a huge array arr pre-allocated:
for (int i = 0; i < N; ++i) {
    size_t idx = random_distribution(generator);
    int x = arr[idx]; // cache miss
    doSomeExtensiveComputation(x);
}
Since the index is a random number, most likely the access arr[idx] will hit a cache miss. We can adopt a pipeline approach to prefetch the next one while executing for the current loop.
size_t idx = random_distribution(generator);
for (int i = 0; i < N; ++i) {
    int x = arr[idx];
    idx = random_distribution(generator);
    // prefetch the element for the next iteration
    __builtin_prefetch(&arr[idx]);
    doSomeExtensiveComputation(x);
}
However notice there are caveats regarding explicit prefetching. Firstly it needs to be distanced properly away from when the memory address will be accessed, usually a couple hundred cycles. If too short, the prefetch might not have finished. If too long, it might pollute the cache and affect other parts of the program performance. And prefetching also consumes CPU resources. A general advice is to always measure the before/after performance metrics when adding explicit prefetching, especially the L3 cache hit rate.
Optimize Computations
When the TMA methodology is applied, inefficient computations are usually reflected in the Core Bound and, to some extent, in the Retiring categories. There are usually two main reasons:
- Data dependencies between software instructions are limiting the performance.
- A shortage in hardware computing resources.
Now we will take a look at methods to optimize the inefficiency in these categories.
Data Dependencies
When a program statement refers to the output of a preceding statement, we say that there is a data dependency between the two statements. When such long data dependencies do come up, processors are forced to execute code sequentially, utilizing only a part of their full capabilities. This prevents modern CPU’s parallelism & out-of-order execution. On the critical path it is the latency of an instruction that matters; Otherwise it’s the throughput. The usual solution here is to break the dependency by unrolling.
Inlining Functions
Function inlining can be helpful if the body of it is small compared to the prologue (PUSH) and epilogue (POP). Compiler usually does a good job finding the good candidates to inline. Programmers could also provide compiler hints to suggest ([[gnu:always_inline]] or __attribute__((always_inline))). But notice inlining could potentially increase code size and compile time.
Loop Optimizations
Loops are the heart of all computationally heavy program. The loop optimizations range from low-level optimizations (move code around in a single loop) to high-level optimizations (reconstruct and affect multiple levels of loop).
Low-level Loop Optimizations
Loop Invariant Code Motion (LICM): if an expression whose value never changes across iterations of a loop, we can move its computation outside the loop.
// before
for (int i = 0; i < N; ++i) {
    for (int j = 0; j < N; ++j) {
        a[j] = b[j] * sin(c[i]);
    }
}

// after
for (int i = 0; i < N; ++i) {
    double tmp = sin(c[i]);
    for (int j = 0; j < N; ++j) {
        a[j] = b[j] * tmp;
    }
}
Loop Unrolling: Instead of modifying an induction variable on each iteration, we can unroll a loop and perform multiple iterations for each increment of the induction variable. The primary benefit is to perform more real computations per iteration to avoid “loop tax”.
// before
for (int i = 0; i < N; ++i) {
    a[i] = b[i] * c[i];
}

// after
for (int i = 0; i + 1 < N; i+=2) {
    a[i] = b[i] * c[i];
    a[i+1] = b[i+1] * c[i+1];
} // assume no remainder
Loop Strength Reduction (LSR): replace expensive instructions with cheaper ones.
// before
for (int i = 0; i < N; ++i) {
    a[i] = b[i * 10] * c[i];
}

// after
int j = 0;
for (int i = 0; i < N; ++i) {
    a[i] = b[j] * c[i];
    j += 10;
}
Loop Unswitching: If a loop has a conditional statement inside and it is invariant, we can move it outside of the loop. While this may double the amount of code written, each of these new loops may now be optimized separately.
// before
for (int i = 0; i < N; i++) {
    a[i] += b[i];
    if (c) {
        b[i] = 0;
    }
}

// after
if (c) {
    for (int i = 0; i < N; i++) {
        a[i] += b[i];
        b[i] = 0;
    }
} else {
    for (int i = 0; i < N; i++) {
        a[i] += b[i];
    }
}
High-level Loop Optimizations
Loop Interchange: to enable sequential memory access. This is only legal if loops are perfectly nested wherein all the statements are in the innermost loop.
// before
for (int i = 0; i < N; i++) {
    for (j = 0; j < N; j++) {
        a[j][i] += b[j][i] * c[j][i];
    }
}

// after
for (int j = 0; j < N; j++) {
    for (i = 0; i < N; i++) {
        a[j][i] += b[j][i] * c[j][i];
    }
}
Loop Blocking (Tiling): to split multi-dimensional execution range into smaller chunks (blocks or tiles) so that each block will fit in the CPU caches.
// before: linear traversal
for (int i = 0; i < N; i++) {
    for (int j = 0; j < N; j++) {
        a[i][j] += b[j][i];
    }
}

// after: traverse in 8*8 blocks, assume no remainder
for (int ii = 0; ii < N; ii += 8) {
    for (int jj = 0; jj < N; jj += 8) {
        for (int i = ii; i < ii + 8; i++) {
            for (int j = jj; j < jj + 8; j++) {
                a[i][j] += b[j][i];
            }
        }
    }
}
Loop Fusion: separate loops can be fused together when they iterate over the same range and do not reference each others’ data. It helps to reduce the loop overhead since both loops can use the same induction variable.
// before
for (int i = 0; i < N; i++) {
    a[i].x = b[i].x;
}
for (int i = 0; i < N; i++) {
    a[i].y = b[i].y;
}

// after
for (int i = 0; i < N; i++) {
    a[i].x = b[i].x;
    a[i].y = b[i].y;
}
Loop Unroll and Jam: to perform this transformation, we need to unroll the outer loop first, then jam (fuse) multiple inner loops together. This helps break the data dependency on the same accumulator variable.
// before
for (int i = 0; i < N; i++) {
    for (int j = 0; j < N; j++) {
        diffs += a[i][j] - b[i][j];
    }
}

// after
for (int i = 0; i+1 < N; i += 2) {
    for (int j = 0; j < N; j++) {
        diffs1 += a[i][j] - b[i][j];
        diffs2 += a[i+1][j] - b[i+1][j];
    }
}
diffs = diffs1 + diffs2;
Vectorization
A lot of time vectorization happens automatically without any user intervention, generating fast SIMD code for a wide variety of programs. The auto-vectorization usually involves three steps:
- Legality check
- Profitability check
- Transformation
There are a few common cases where people run into that prevent vectorizations.
Vectorization is Illegal
Hard limit like read-after-write dependence prevents vectorizations:
void vectorDependence(int *A, int n) {
    for (int i = 0; i < n; i++) {
        A[i] = A[i-1] * 2;
    }
}
Soft limit like floating-point arthimetic by default is not considered “associative” by compiler. If you can tolerate a bit of variation, -ffast-math is the right compiler flag to use globally or use #ppragma clang fp reassociate(on) in front of particular loops.
Vectorization is not Beneficial
Compiler internally has a cost model that tradeoff if a place is worth vectorization. Sometimes the answer is No. Vector instructions could lead to frequency downclocking or startup overhead.
Loop Vectorized but Scalar Version Used
If the generated code assume loop trip count higher than what the program uses. For example, the compiler generates the vectorized code to process 64 elements at a time, but the input array during execution always has less than 64 elements, then the scalar version of the code is executed instead. Programmers may explicitly use #pragma clang loop vectorize_width(N) to tackle this.
Lastly, vectorization is not a pure-all. Sometimes the scalar version of the code outperforms the vectorized version. So always measure before hands on manual vectorization solutions.
Optimize Branch Prediction
Mispredicting a branch can add significant penalty in CPU when it happens frequently. Typically on modern CPUs it amounts to a 10 to 25 cycles penalty. Branch predictors use caches and history registers to store dynamic branch history. Therefore it is susceptible to:
- Cold misses: when no dynamic history is available
- Capacity misses: loss of dynamic history due to a very high number of branches in program
- Conflict misses: branches mapped into same cache bucket (associative sets)
It’s normal for a general purpose application to have a 5% to 10% Bad Speculation metric. Once it rises above 10% we should pay more attention to it. There are several ways programmers could explicitly optimize for branch prediction.
Replace Branches with Lookup
One way to avoid frequently mispredicted branches is to use lookup table. For example,
// before
int8_t mapToBucket(unsigned v) {
    if (v < 10) return 0;
    else if (v < 20) return 1;
    else if (v < 30) return 2;
    else if (v < 40) return 3;
    else if (v < 50) return 4;
    return -1;
}

// after
int8_t buckets[50] = {
    0, 0, 0, 0, 0, 0, 0, 0, 0, 0,
    1, 1, 1, 1, 1, 1, 1, 1, 1, 1,
    2, 2, 2, 2, 2, 2, 2, 2, 2, 2,
    3, 3, 3, 3, 3, 3, 3, 3, 3, 3,
    4, 4, 4, 4, 4, 4, 4, 4, 4, 4,
};

int8_t mapToBucket(unsigned v) {
    if (v < sizeof(buckets) / sizeof(int8_t))
        return buckets[v];
    return -1;
}
For the improved version of mapToBucket, the compiler will likely generate a single branch instruction that guards against out-of-bound access to the buckets array, instead of having many branches as in the original version.
Replace Branches with Arithmetic
Same function mapToBucket we can write it using arithemtic:
int8_t mapToBucket(unsigned v) {
    constexpr unsigned BucketRangeMax = 50;
    if (v < BucketRangeMax) {
        return v / 10;
    }
    return -1;
}
Replace Branches with Selection
Some branches could be effectively eliminated by executing both parts of the branch and then selecting the right result. If the branch functions are small and the compiler can inline them, then selection might bring noticeable performance benefits. If the functions are big and expensive to compute, then it might be actually cheaper to take the cost of a potential branch mispredict.
// before
int a;
if (cond) {
    a = computeX();
} else {
    a = computeY();
}
foo(a);

// branch selection
int x = computeX();
int y = computeY();
int a = (cond) ? x : y;
foo(a);
Multiple Tests Single Branch
The main idea here is to avoid executing a branch for every element of a large array. Instead, the goal is to perform multiple tests simultaneously, which primarily involves using SIMD instructions.
Optimize Machine Code Layout
As the new processors get more computation power, the CPU Fronend (FE) needs to fetching and decoding instructions fast enough to deliver to the Backend, otherwise the overall performance suffer. In the TMA methodology, below 10% Frontend Bound metric is normal for typical application. If it’s more than 20%, it is worth investigation.
A basic block is a sequence of instructions with a single entry and a single exit. This is an imporatn property leveraged by many compiler transformations because it reduces the problem of control flow graph analysis and transformation.
Basic Block Placement
Compiler can transform the basic block placement so that it maintains fallthrough hot code path and move away the cold path. It’s beneficial because not-taken branches are cheaper and it achieves better instruction cache utilization.
Basic Block Alignment
Compiler will insert/shift hot code using NOPs instructions to pad them within one cacheline if possible. This is particular useful for hot loops to achieve better instruction cache utilization.
Function Splitting
Compiler can split cold blocks of code and place them into separate functions. This makes the original code path “smaller”: the cold function body is replaced by a jump instruction that’s rarely executed. This is helpful for functions with complex CFG when there are big blocks of cold code between hot parts.
Function Reorder
Linker could group hot functions together to achieve better cache utilization. This is helpful when there are many small hot functions.
Profile Guided Optimization
Compiler could have generated more efficient/tailored code if it knows more about the typical use cases of the application. This is when profiling information comes handy. By providing particular flags (for example -fprofile-instr-generate) to compiler, it can first generate instrumented binary and run to produce profile data. Then the compiler could recompile the binary using the profile data as a prior guide.